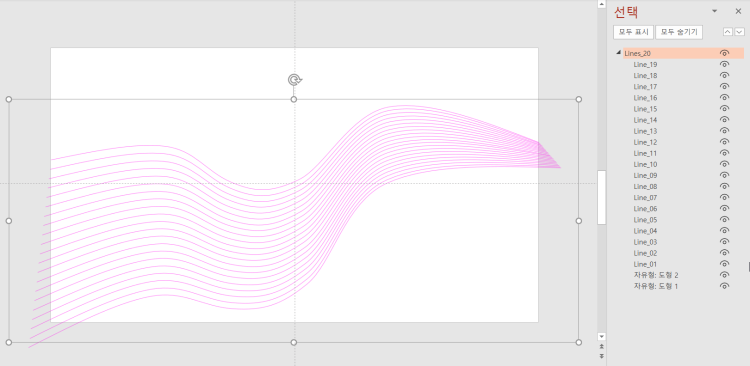
위와 같은 물결무늬 디자인을 파워포인트에서 만드는 방법입니다.
관련: 지식인
반복되는 선은 인터넷에서 검색해서 이미지로 받을 수도 있지만
곡선과 파워포인트 VBA를 이용해서 만들 수도 있습니다.
0. 첨부파일을 다운로드하고 파일속성에서 차단해제 체크/확인하시고 파일을 열 때 매크로를 허용합니다.
1. 슬라이드에 '곡선' 도형을 이용해서 2개의 곡선 도형을 그려주세요.

점편집을 이용해서 서로 겹치게 하거나 회전 각도를 조절해도 됩니다.
중간에 생성되는 선들은 첫번째 선의 속성을 따라갑니다. 선의 두께나 색상을 조절하세요.

2. alt-F8을 누르고 매크로를 실행합니다.

3. 아래와 같이 두 곡선 사이에 선을 추가해줍니다.

4. 이 곡선의 투명도나 색깔을 편집하고 마우스 우클릭해서 그림으로 저장합니다.
그림형식은 벡터형식인 emf 나 svg 가 좋습니다.

5. 이 상태에서 AddGradiantTransparency 를 실행하면 점진적으로 그라디언트 투명효과를 적용합니다.

투명도가 0.5에서 시작해서 0.9로 끝나는데 이 값을 바꿔서 투명도를 조절할 수 있습니다.
0.5는 절반 정도 투명이고 1이면 아예 투명해서 안보이게 됩니다.
위 방법으로 만든 곡선 예시1

위 방법으로 만든 곡선 예시2


최초 곡선의 형태와 각도, 투명도에 따라서 여러가지 모양으로 만들어볼 수 있습니다.
아래는 두 곡선 사이에 곡선을 추가하고 투명도를 조절해주는 VBA 코드입니다.
더보기
' https://www.youtube.com/watch?v=ihsjKYxajLY
' WORD: Wavy header graphics with VBA (Tutorial)
' by Vaclav Krejci, (Converted to PPT by konahn)

Option Explicit

Sub wavy_header()
'
' wavy_header Macro
'
    Dim sld As Slide
    Dim shp1 As Shape, shp2 As Shape
    Dim shape1_vert As Variant, shape2_vert As Variant, shape_new_vert As Variant
    Dim vert_count As Integer, num_shapes As Integer, c As Integer, counter As Integer
    Dim t_param As Single

    On Error Resume Next
    With ActiveWindow.Selection
        Set sld = .SlideRange(1)
        Set shp1 = .ShapeRange(1)
        Set shp2 = .ShapeRange(2)
    End With
    If sld Is Nothing Or shp1 Is Nothing Or shp2 Is Nothing Then MsgBox "Select two curves first.": Exit Sub
    On Error GoTo 0

    shape1_vert = shp1.Vertices
    shape2_vert = shp2.Vertices
    shape_new_vert = shp1.Vertices
    vert_count = UBound(shp1.Vertices)
    num_shapes = 20     'how many lines will be added between the two curves

    shp1.Select
    shp1.ZOrder msoSendToBack
    shp1.PickUp 'copy format
    For c = 1 To num_shapes - 1

        t_param = c / num_shapes

        For counter = 1 To vert_count
            shape_new_vert(counter, 1) = shape1_vert(counter, 1) + (shape2_vert(counter, 1) - shape1_vert(counter, 1)) * t_param
            shape_new_vert(counter, 2) = shape1_vert(counter, 2) + (shape2_vert(counter, 2) - shape1_vert(counter, 2)) * t_param
        Next counter

        With sld.Shapes.AddCurve(shape_new_vert)
            .Name = "Line_" & Format(c, "00")
            .Apply      'apply the format of shp1 to new lines
            .Select (False)
        End With

    Next c
    shp2.ZOrder msoBringToFront
    shp2.Select False
    ActiveWindow.Selection.ShapeRange.Group.Name = "Lines_" & num_shapes

End Sub

Sub AddGradiantTransparency()

    Dim sld As Slide
    Dim shp As Shape, cshp As Shape
    Dim t As Integer, c As Integer
    Dim stp As Single, tStart As Single, tEnd As Single

    On Error Resume Next
    With ActiveWindow.Selection
        Set sld = .SlideRange(1)
        Set shp = .ShapeRange(1)
    End With
    If sld Is Nothing Or shp Is Nothing Or shp.Type <> msoGroup Then MsgBox "Select a group shape first.": Exit Sub
    On Error GoTo 0

    tStart = 0.5
    tEnd = 0.9
    t = shp.GroupItems.Count
    stp = Abs(tStart - tEnd) / t
    For Each cshp In shp.GroupItems

        cshp.Line.Transparency = tStart + c * stp
        c = c + 1

    Next cshp

End Sub
첨부파일:
'PPT+VBA' 카테고리의 다른 글
| 둥근 네모의 둥근 정도를 도형이 크기와 상관 없이 유지하는 방법 (0) | 2024.06.02 |
|---|---|
| 슬라이드 노트가 있는 슬라이드만 출력하기 (0) | 2024.05.28 |
| 사진을 여러 칸(박스)로 자동으로 분할하기 (0) | 2024.05.18 |
| PPT 일부 슬라이드만 블러처리된 그림 프레젠이션 만들기 (1) | 2024.04.28 |
| 폴더 내의 모든 pptx파일의 모든 슬라이드를 png로 내보내기 (0) | 2024.04.02 |
| 편집 모드에서 자동으로 동영상 재생 (0) | 2024.03.13 |
| Freeform 도형을 따라 잉크 그리기 애니메이션 자동 생성 (1) | 2024.02.25 |
| 100슬라이드 중 랜덤(무작위) 5슬라이드 재생 (1) | 2024.01.19 |


최근댓글